

2026 GDS-Index Stories – What the Data Tells Us
2026 GDS-Index Stories reveal how destinations spark sustainability scale, with leaders pulling ahead in management.
7 Views
Seeds and sparks
A seed that needs fire to germinate will wait for an electric storm, but a destination must spark the scale of its sustainability performance. Vetted and verified benchmarking data from GDS-Index illustrates.
Every destination in the GDS-Index* arrives with a stack of sustainability scaling potential. Geography, climate, infrastructure and the wider conditions of a place shape its Environmental and Social scores long before a sustainability team enters the picture.

The Slow Burn
Despite this potential, a destination may do extensive work and see little of it in a single year because the payoff comes with continual effort over time. For example, in the environmental category:
- A DMO or CVB cannot legislate its way to cleaner energy but it can encourage the process by partnering with departments and programmes dedicated to doing so
- Transport networks can take decades to decarbonise
- Energy grids are rebuilt as renewable over generations
In the 2026 data, the average destination and the Top 10 sit relatively close together on Environmental and Social categories. Environmental moves from an average of 75.0% to 83.9% for the Top 10, a distance of 8.9 points. Social moves from 77.3% to 87.3%, a distance of 10.0.

Burning Bright
Then the picture changes. In Supplier and Destination Management, the leaders pull ahead. Supplier stretches from an average of 67.2% to 88.0%, a span of 20.7 points. Destination Management runs from 75.9% to 94.3%, a span of 18.4 points. That 94.3% is the highest category average any group has recorded in the index, edging past the previous best of 91.9% set in 2023.
We believe we see these differences because the supplier and management category score growth is sparked by what a destination chooses to do. It includes actions like:
- supporting hotels, venues, and agencies to earn sustainability certification
- writing a destination sustainability strategy
- measuring what matters
- reporting results in public
Management matured quickly this year, and the individual criteria show it:
- Impact programmes climbed from 50.5% to 65.9%.
- Employee management processes gained 11.3 points.
- Destination-level visitor management gained 10.1.
- Protection of naturally and culturally sensitive sites rose 12.9 points to 77.0%.
- Bringing professional congress organisers into sustainability policies rose 10.9.

What The Spark Means for Event Planners and Associations
For anyone choosing where to hold an event, this is useful to know. A strong Supplier or Destination Management score suggests an organisation that takes its commitments seriously. A strong Environmental score says a great deal about how a city is run, and it may shape how delegates see an event held in it.

Choose The Spark
Informed action is more reliable than waiting for a lightning bolt in a universe of butterflies and flash floods and is often championed by small teams or inspired individuals with modest budgets and great stores of ambition and innovation.
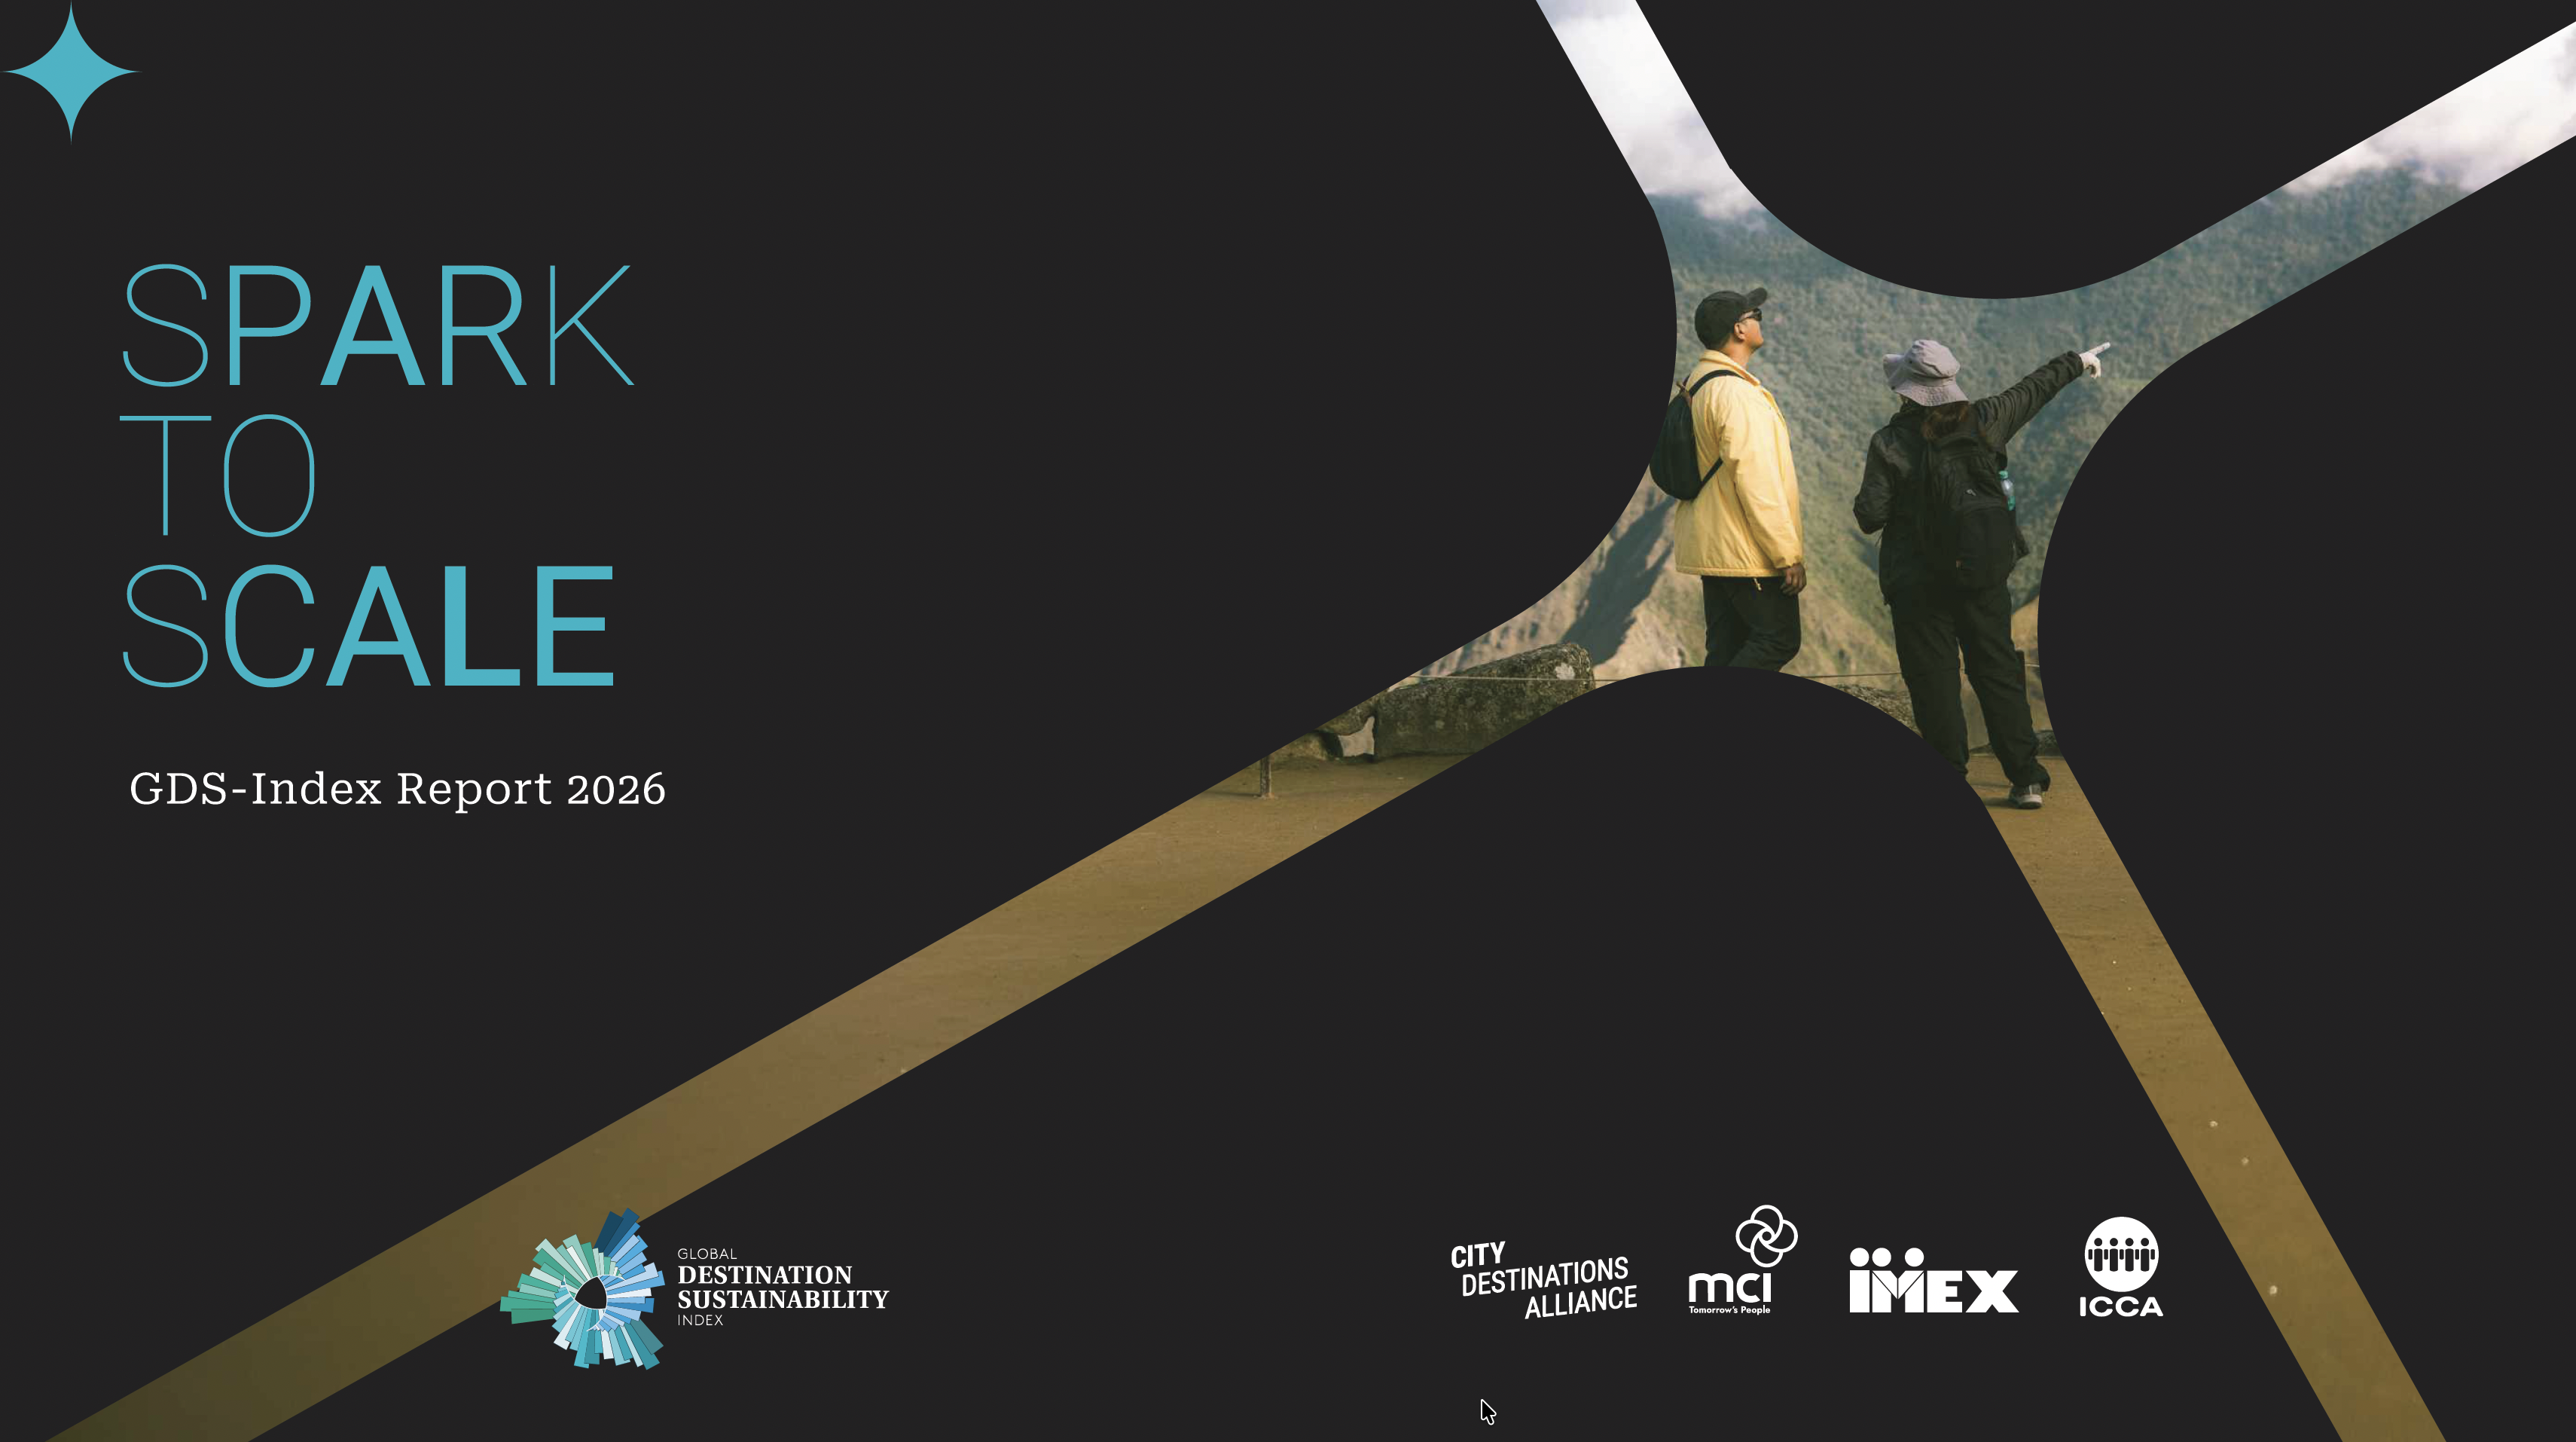
If you would like to see how the leaders go from spark to scale, you can download it below.
Get this and more in the full report
* The GDS-Index is a global benchmarking and performance improvement programme that helps destinations measure, manage, and improve their sustainability performance through a structured, data-driven framework. It assesses environmental, social, supplier, and destination management indicators, enabling cities and regions to benchmark progress and strengthen their competitive edge.
Beyond measurement, the GDS-Index supports destinations to build systems to manage, monitor, and continuously improve their sustainability performance. It helps organisations move from fragmented data and reporting to clear indicators, evidence-based decision-making, and structured sustainability management. The programme also provides a development pathway for destination management organisations, guiding them from initial engagement through the implementation of a Sustainable Management System and ultimately towards certification readiness.