
2026 GDS-Index Highlights – A Record-setting Year for Destinations
Explore the achievements of the 2026 Global Destination Sustainability Index Top 40, Leadership & Most Improved Destinations
10 ViewsAverage Performance in 2026: Onwards and Upwards!
We’re proud of the commitment and progress demonstrate by destinations who choose to participate in the Global Destination Sustainability Index each year. In 2026, 74% improved their performance, a record high since its beginnings in 2016.
This improvement is even higher in the Top 10, which earned an 89% average performance improvement this year.
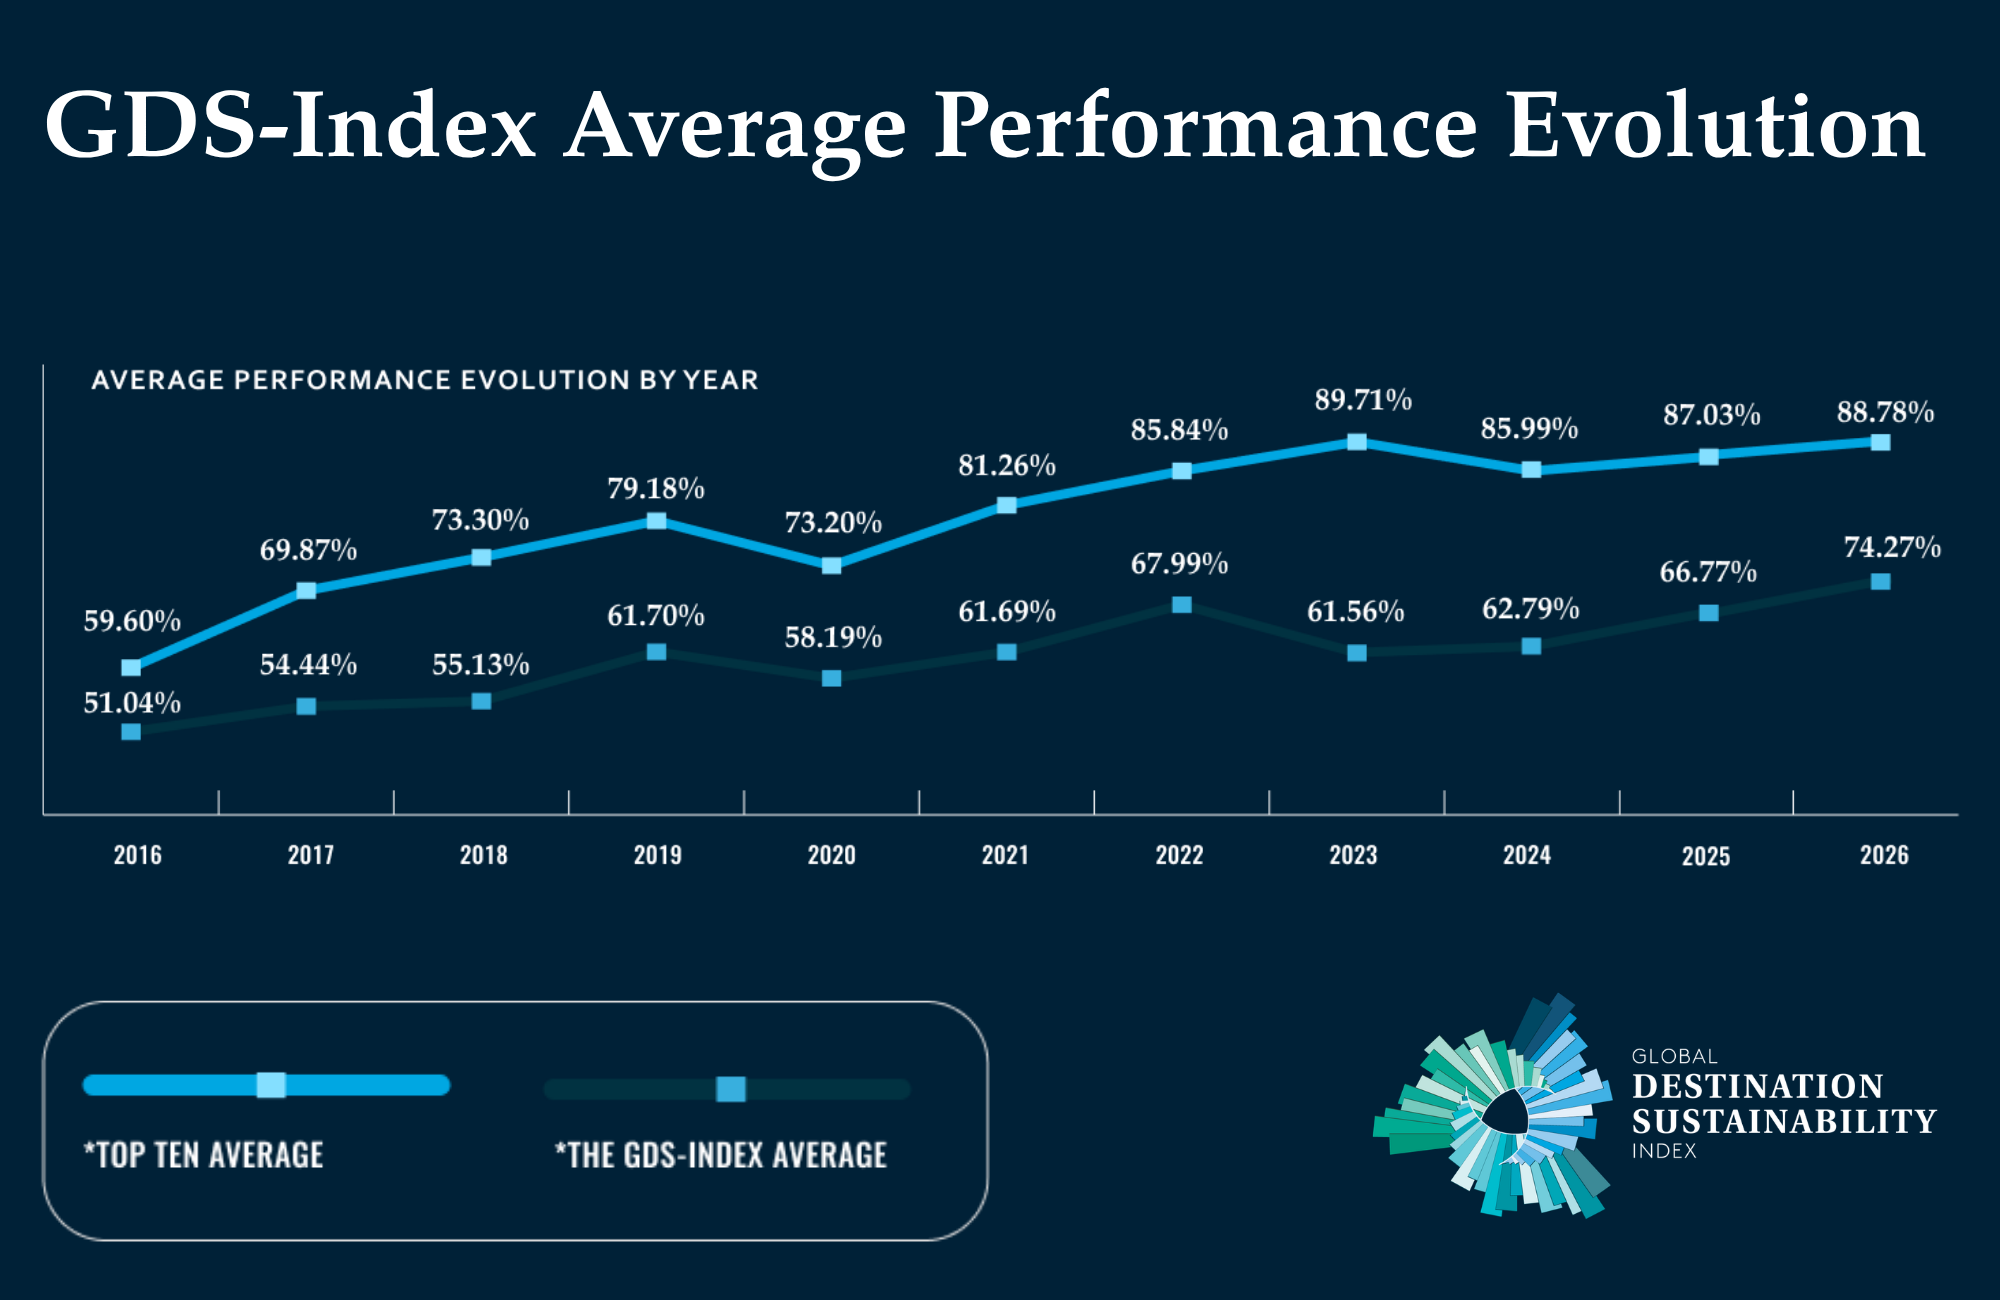
This is an astounding and encouraging result for the 11th round of benchmarking.
The GDS-Index is a global benchmarking and performance improvement programme that helps destinations measure, manage, and improve their sustainability performance through a structured, data-driven framework. It assesses environmental, social, supplier, and destination management indicators, enabling cities and regions to benchmark progress and strengthen their competitive edge.
Beyond measurement, the GDS-Index supports destinations to build systems to manage, monitor, and continuously improve their sustainability performance. It helps organisations move from fragmented data and reporting to clear indicators, evidence-based decision-making, and structured sustainability management. The programme also provides a development pathway for destination management organisations, guiding them from initial engagement through the implementation of a Sustainable Management System and ultimately towards certification readiness.
The Top 40: New Records, Stiffer Competition
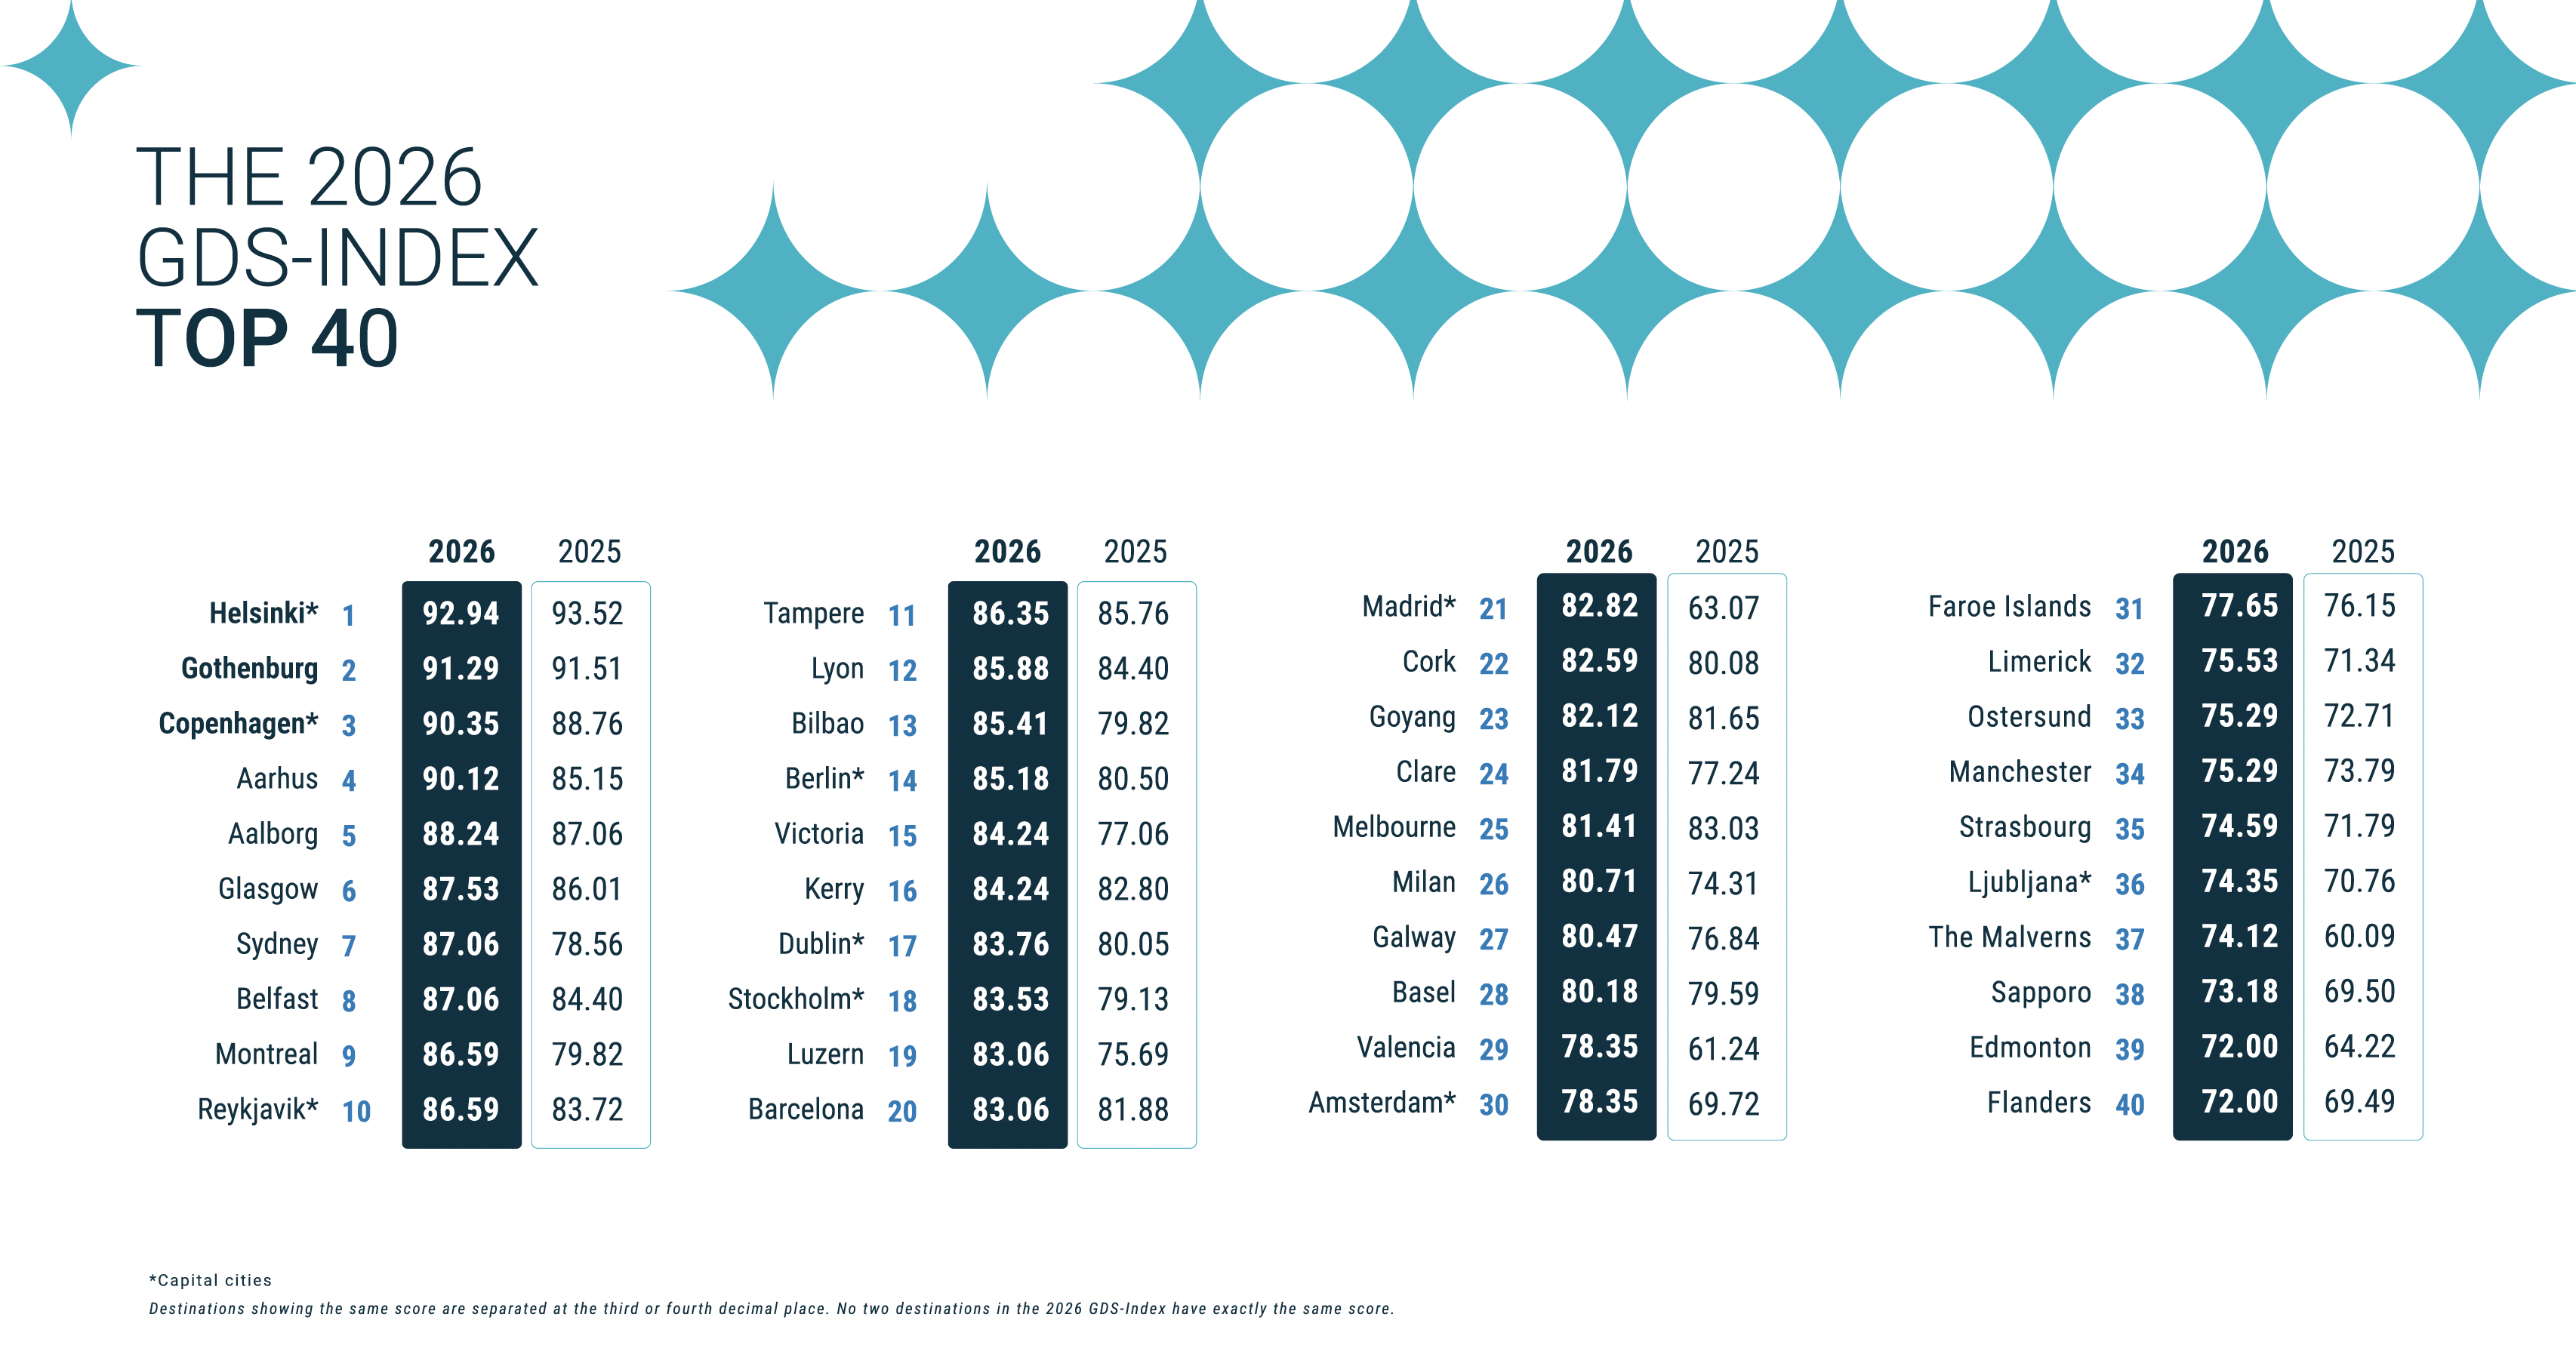
Getting into, staying in, or rising in the ranks of the GDS-Index Top 40 depends on the year, because baselines each year are set by the participants. This year performance rose in almost all the lists.
- The eleventh to twentieth band, the twenty-first to thirtieth band, the thirty-first to fortieth band and the Top 40 average are all the highest in the history of GDS-Index.
Attaining or maintaining (or beating) a position is becoming more of a challenge. A score that placed eleventh in three of the past four years places twentieth this year.
- Destinations that held their ranking this year did so while the score required to hold it went up by between two and three percentage points.
- Those entering the Top 40 for the first time did so against the second-highest entry threshold ever recorded.
This is what an improvement programme should look like from the inside. The value of a position is set by how hard it is to hold, and this year it was harder than it has ever been, making the value of a Top 40 ranking matter more than it ever has.
With this in mind, let’s have a look at two recognised achievers.

Most Improved Destination: Bremen
In a single year, Bremen advanced from zero to full marks on strategy, stakeholder involvement, tourism impact, measurement, event impact measurement, and integrated mobility.
Bremen also moved from having no qualifying impact measurement system to full marks for measuring the economic, social, and environmental impacts of both tourism and events.
By integrating measurement while the strategy was still being developed, it created a more integrated destination management framework which led to swift advances.
Bremen was awarded the Most Improved Destination this year, based on its year-on-year improvements. It is represented by Bremen Tourismus.

Leadership Destination: Helsinki
Helsinki leads the Supplier category outright with the highest score recorded anywhere in the index this year.
It scored maximum points across all climate-related criteria and continues to build capacity among suppliers and staff while strengthening regional collaboration through leading a climate action programme involving destinations across the Baltic Sea region.
Helsinki’s supply chain is closer to full certification than any other participating destination. 99% of assessed* hotel rooms, 100% of convention centres, 92% of professional congress organisers and 90% of its top attractions hold third-party sustainability certification.
Helsinki was named the Leadership Destination this year, based on its overall ranking. It is represented by City of Helsinki.